

Repair, hospital, legal and liability claim costs have been climbing well ahead of consumer prices. Insurers that still benchmark claims to CPI run the risk of under-reserving, and of missing cost drivers in their own files that they can still do something about.
Headline U.S. consumer inflation was 3.7% for the 12 months ending September 2026, up from 3.4% in August. Gasoline prices, up 34.2%, were the main reason. Take out food and energy and consumer prices rose just 2.6%.1 For P&C insurers, neither number says much about what claims actually cost. Auto repair, hospital care, outside counsel and liability settlements have been rising faster than either measure, in many cases for several years now.1, 2, 7
There are two reasons claims costs run ahead of general inflation.
The first is the price of what claims depend on. Skilled labor, vehicle technology, medical treatment and legal services are all getting more expensive faster than the consumer basket.
The second is that the claims themselves have become more complex. Repairs and treatment are more extensive, more claims end up in litigation, settlements and jury awards are larger, and files take longer to close. You won’t find any of that in a price index.
Our view at Alan Gray is that claims inflation has to be managed file by file. An industry index can tell you that costs are going up. Only the claim file can tell you whether a particular increase reflects market prices, a change in scope, or a handling decision that can still be changed. Organizations that test files, invoices and reserves against current costs early, while those decisions are still open, are in a much stronger position than those that wait for adverse development to show them the gap.
Key Takeaways
- Auto repair, hospital, legal and liability severity costs are all rising faster than core CPI, several of them at more than twice the rate.
- Each year’s increase builds on the last one, so the most exposure sits in long-tail claims and in reserves set on older cost assumptions.
- Triple-I and the Casualty Actuarial Society estimate that increasing inflation added $231.6 billion to $281.2 billion to auto and general liability losses from 2015 to 2024.7
- File-level review of reserves, vendor costs and legal spend is how insurers tell an unavoidable price increase apart from cost that can still be avoided.
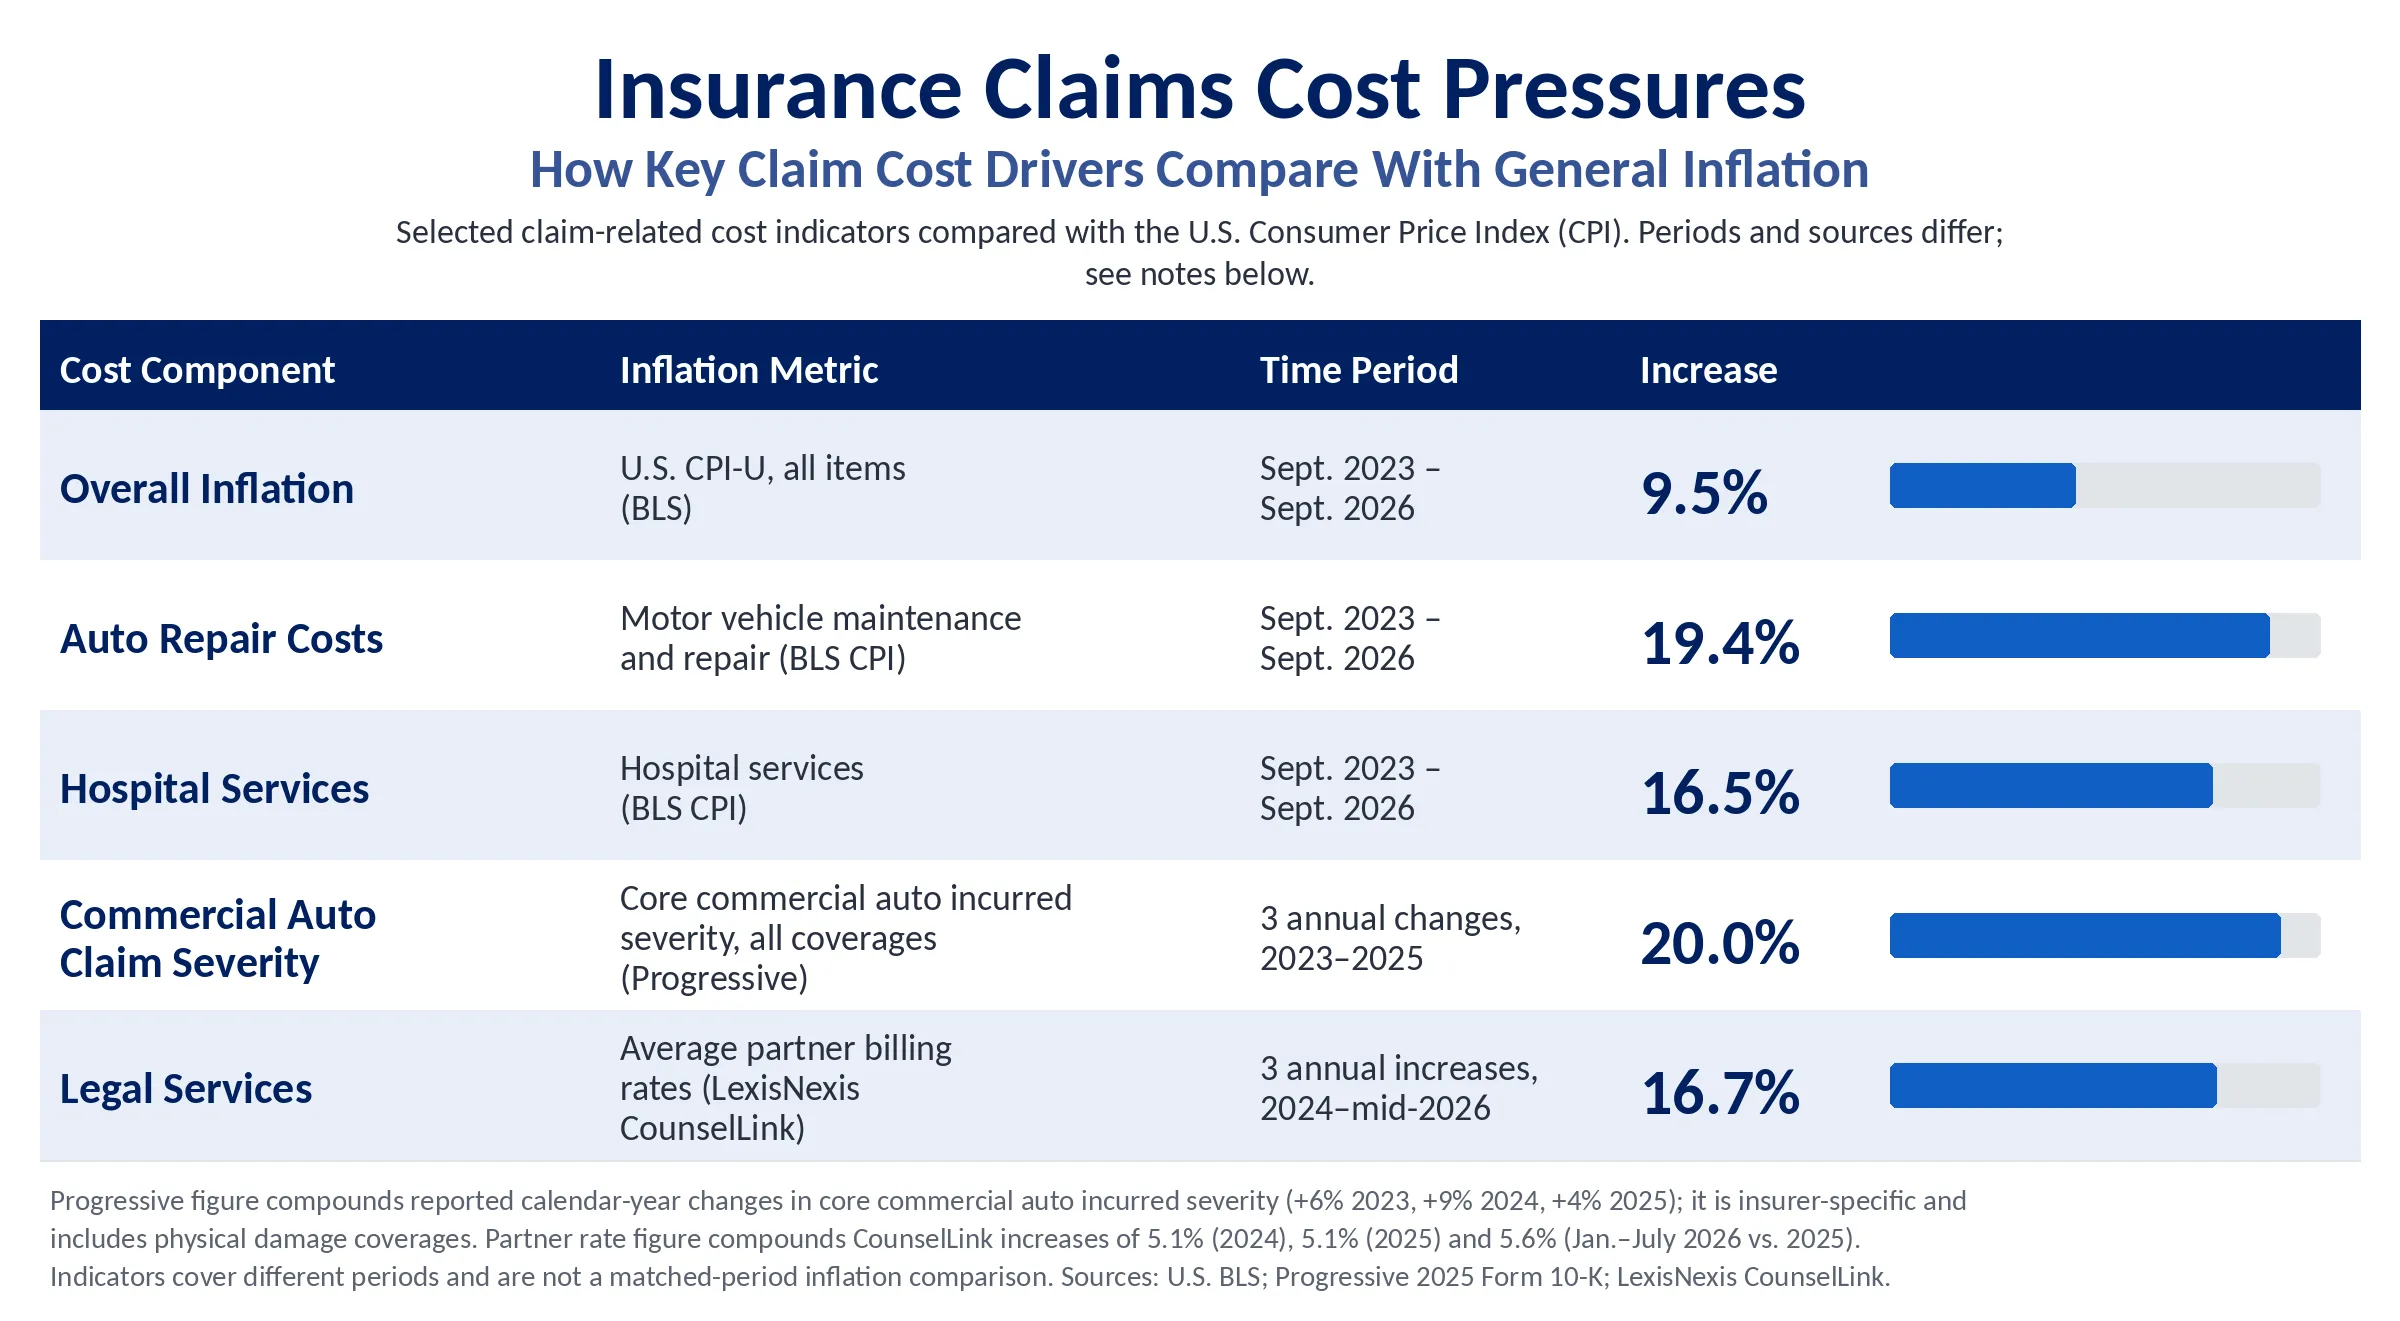
Infographic sources and methodology: see Sources1, 2, 3, 4. Indicators cover different periods and sources and are not a matched-period comparison.
How Earlier Increases Stay in Claims Costs
When annual inflation slows down, the earlier increases don’t go away. They stay in the cost base, and each new increase is applied on top of them.
Take a repair that cost $100,000 before replacement costs went up a cumulative 30%. The same repair now costs $130,000. If inflation then slows to 2%, the cost the following year is about $132,600. That is $32,600 above the original estimate, where someone looking only at this year’s 2% would expect $2,000. Claims that stay open for years, and reserves set on older cost assumptions, are where these shortfalls show up.
Property and Auto Repair Costs Have Reset Higher
Property claims costs depend on construction materials, contractor availability, skilled labor and regional market conditions, and any of these can move very differently from general inflation. In December 2025 the Insurance Information Institute (Triple-I) reported that structural replacement costs for homes had risen nearly 30% over five years, or roughly 5.4% a year compounded. It pointed to supply chain disruptions, higher material costs and labor shortages.5 Those increases feed straight into reserves, settlement evaluations and loss forecasts, and they matter most on claims that stay open a long time.
| Cost indicator | Increase | Measurement period |
|---|---|---|
| Home structural replacement costs | Nearly 30% (approx. 5.4% annually) | Five years through 2025 |
| Motor vehicle maintenance and repair CPI | 19.4% | Sept. 2023–Sept. 2026 |
| Motor vehicle maintenance and repair CPI | 5.8% | Sept. 2025–Sept. 2026 |
| Motor vehicle body work CPI | 6.0% | Sept. 2025–Sept. 2026 |
| Motor vehicle maintenance and servicing CPI | 7.8% | Sept. 2025–Sept. 2026 |
| General CPI (all items) | 3.7% | Sept. 2025–Sept. 2026 |
| Core CPI (all items less food and energy) | 2.6% | Sept. 2025–Sept. 2026 |
Auto repair looks much the same. Motor vehicle maintenance and repair prices rose 5.8% in the 12 months ending September 2026, more than double core inflation, with body work up 6.0% and maintenance and servicing up 7.8%. Over three years the repair index is up 19.4%, about twice the 9.5% rise in overall CPI.1 Over the past year, meanwhile, the CPI for motor vehicle insurance fell 5.0%.1 With auto pricing softening and repair costs still climbing, claims handling will have to carry more of the weight in auto results.
Advanced driver-assistance systems, specialized components and calibration requirements all make repairs more complicated. For a claims team, the more useful question is why a repair cost went up. Once reviewers separate price increases from changes in repair scope, they can see which supplements, vendor charges and estimates deserve a closer look.
Liability Severity Is Running Ahead of Economic Inflation
Liability claims are a different problem. Their value reflects medical expenses, lost earnings and other economic damages, but it is also shaped by how much litigation there is, what plaintiffs expect to settle for and what juries award.
Swiss Re Institute uses the term liability excess inflation for growth in liability claim severity beyond what economic inflation can explain. Its January 2026 research points to changes in law, easier access to litigation, third-party litigation funding and rising awards as the main sources of that excess.6 According to Risk & Insurance, Swiss Re estimates that these non-economic factors account for roughly 60% of U.S. liability claims growth over the past decade.10
A 2025 study by Triple-I and the Casualty Actuarial Society (CAS) looked at liability losses and defense costs from 2015 through 2024. It estimated that increasing inflation added $231.6 billion to $281.2 billion to losses across four auto and general liability lines. Severity, rather than frequency, was the primary driver.7
| Line of business | Cumulative growth | CAGR |
|---|---|---|
| Commercial auto liability | 93.5% | 7.6% |
| Personal auto liability | Approx. 85%* | 7.1% |
| Other liability, occurrence | Approx. 81%* | 6.8% |
| Products liability, occurrence† | 512.5% | 22.3% |
| General consumer inflation (CPI-U) | Approx. 33%* | 3.2% |
*Derived from the study’s reported compound annual growth rate. †Products liability is a small line, and its severity is highly sensitive to individual large claims and portfolio mix. Source: Triple-I/CAS7.
Commercial auto liability severity rose 93.5% between 2015 and 2024. That is about 7.6% a year, against 3.2% annual growth in consumer prices. Other liability occurrence severity grew 6.8% a year. Personal auto liability severity grew 7.1% a year, and the pace picked up from 3.5% a year in 2015–2019 to 10.9% a year since.7 ISO data published by Triple-I show the same thing at the claim level, where the average private passenger auto bodily injury liability claim went from $17,014 in 2015 to $28,278 in 2024.8
The effect isn’t limited to newly reported claims. Long-tail liabilities can stay open for years, and for all that time they are exposed to changes in medical costs, settlement expectations and litigation expense. When actual severity runs ahead of the assumptions built into reserves, ultimate losses and future cash requirements have to be revisited. The earlier a gap is found in the file, the less it costs to close.
Legal Expense Is About More Than Billing Rates
Legal expense is a big part of claims inflation, especially on complex liability matters, and outside counsel rates have kept going up even as the broader inflation measures cooled off.
The LexisNexis CounselLink 2026 Mid-Year Special Edition Trends Report found that average partner billing rates rose 5.6% for January through July 2026 compared with the same period in 2025. That is the largest increase since CounselLink began tracking in 2013, and it’s above the 5.1% increases in both 2024 and 2025. Associate rates went up faster still, by 7.9% on average and 11.1% at firms with more than 750 lawyers.2
| Outside counsel billing indicator | Change | Measurement |
|---|---|---|
| Average partner billing rates | 5.6% | Jan.–July 2026 vs. 2025 |
| Average associate billing rates | 7.9% | Jan.–July 2026 vs. 2025 |
| Associate rates, firms with 750+ lawyers | 11.1% | Jan.–July 2026 vs. 2025 |
| Highest-rate 20% of associates | 11.4% | Median increase, 2026 |
| General CPI (all items) | 3.7% | Sept. 2025–Sept. 2026 |
Those averages hide a lot of variation. About one in five partners had no rate increase in 2026 and more than 15% took a decrease, while the highest-rate 20% of partners had a median increase of about 8%.2 With that kind of spread, insurers should be looking at individual timekeeper rates and staffing mix rather than firmwide averages. It is also why approved rate schedules and enforceable billing guidelines matter.
Rate increases build on each other too. At a steady 6% a year, a $500 hourly rate becomes about $669 within five years, with no change to the billing arrangement. Total defense spend can grow faster than that when matters need more hours, more senior or specialized timekeepers, additional experts, or a longer time to resolution.
The management opportunity is in the gap between rate inflation and growth in total legal expense. Looking at rates, staffing, hours and case development together shows whether defense spend is moving with the market, or whether particular matters, firms or billing patterns need attention.
Medical Costs and Claim Severity
Medical costs drive bodily injury and long-duration claims. But medical price increases vary widely from one service to another, and they don’t translate directly into average claim cost.
| Cost indicator | Increase | Measurement period |
|---|---|---|
| Hospital services CPI | 16.5% | Sept. 2023–Sept. 2026 |
| Physicians' services CPI | 6.2% | Sept. 2023–Sept. 2026 |
| General CPI (all items) | 9.5% | Sept. 2023–Sept. 2026 |
| Hospital services CPI | 5.6% | Sept. 2025–Sept. 2026 |
| Physicians' services CPI | 2.1% | Sept. 2025–Sept. 2026 |
| General CPI (all items) | 3.7% | Sept. 2025–Sept. 2026 |
Source: U.S. Bureau of Labor Statistics1. Three-year changes are calculated from unadjusted index levels for September 2023 and September 2026. CPI categories measure consumer prices, not insurance claim severity.
Hospital services prices rose 16.5% between September 2023 and September 2026, well above general inflation of 9.5%. Physicians’ services rose 6.2% over the same period. Hospital prices are still running ahead, up 5.6% in the latest 12 months against 2.1% for physicians’ services and 3.7% for all items.1
Price is only part of it. NCCI estimates that workers’ compensation medical lost-time claim severity rose about 4% in accident year 2025, more than double the 1.8% increase in its weighted medical price index. Its preliminary analysis found that price and utilization each contributed about three percentage points to a 6% increase in medical cost per claim between 2024 and 2025.9
Anyone evaluating bodily injury claims and future medical exposure has to keep that distinction in mind. Higher hospital prices raise treatment costs, but changes in utilization, treatment patterns and injury complexity can push severity higher even in a year when medical price inflation eases. Whether the treatment is related and reasonable, and whether it is actually moving the claim toward resolution, can only be answered in the file. An aggregate index won’t tell you.
How Alan Gray Can Help
Insurers cannot control CPI, hospital pricing or jury attitudes. What they can control is how quickly they pick up changing costs in their own files, and how carefully they test the reserves, vendor charges and legal spend on those files. That is the work Alan Gray does. Our independent auditors and reviewers average more than 25 years of claims experience. They examine every file in scope rather than relying on software alone, and they combine technology with experienced judgment. Early review costs little, compared with the adverse development it can prevent.
Our claims audits and reserve reviews cover open inventories across P&C lines, including auto, property, construction defect, workers’ compensation, healthcare and professional liability, general liability and mass tort. We check whether reserves reflect what repairs, medical care and settlements cost today, flag older files still carrying outdated assumptions, and pick out vendor and expense charges that need a harder look. We do the same work on delegated business through MGA, TPA and coverholder audits. Settlement authority limits and reserving thresholds set years ago may no longer fit current claim values, so we look at reserve adequacy, authority compliance and handling quality, and carriers and capacity providers aren’t surprised by inflation working through someone else’s files.
On the legal side, our attorney-led bill audit, billing guideline development and panel counsel reviews work alongside SIMS, our legal e-billing platform. Clients get visibility into rate, staffing and hours trends by firm and by timekeeper, and approved rates are enforced before invoices are paid. SIMS clients average 6–15% savings, and 84% of the invoices we review contain at least one non-compliant item.
Rising severity also wears down self-insured retentions and deductibles faster, and it pushes more claims toward reporting thresholds and into reinsurance layers. For captives, risk retention groups, self-insureds and their insurers, we confirm that exhaustion is calculated correctly and that only covered, compliant loss and expense is applied. For cedents and reinsurers, our treaty and facultative audits, billing and collections support, Schedule F work and commutation analysis help confirm that notices are timely, cessions are complete and recoverables hold up as loss estimates develop.
Inflation also changes projected earnings, business interruption losses, future medical costs and other economic damages. When those are in dispute, our forensic accountants and quantitative team support the damages work, allocation modeling and decision-tree settlement analysis, so settlement positions reflect current, documented costs. Long-tail books feel cumulative inflation the most, and for legacy portfolios our specialty TPA claims handling and A.G. Risk Management’s run-off back-office and statutory/GAAP accounting services keep claim values, reserves and reporting current.
A good place to start is a targeted review of the files most exposed to these cumulative increases. That usually means litigated bodily injury claims, long-tail liability reserves, and the outside counsel relationships that account for the largest share of defense spend. To discuss a claims, reserve or legal spend review, contact Alan Gray at info@alangray.com.
Related Reading
- Controlling Social Inflation Through Claims Management
- Legal Spend & Litigation Monitor: Q3 2026
- Workers’ Compensation Legal Spend: Why Claim Complexity Matters
Citations
- U.S. Bureau of Labor Statistics. “Consumer Price Index — September 2026.” 14 Oct. 2026; “Consumer Price Index — September 2023.” 12 Oct. 2023. Three-year changes use September unadjusted index levels; one-year changes are September 2025–September 2026. September 2026 release | September 2023 release
- LexisNexis CounselLink. “2026 Mid-Year Special Edition Trends Report” and “Outside Counsel Rates Still Climbing; Average Hiding Bigger Story.” 2026. Based on January–July corporate outside-counsel invoices; not specific to insurance defense. Report | Summary
- The Progressive Corporation. Annual Report on Form 10-K for 2025, filed 2 Mar. 2026, Management’s Discussion and Analysis, Commercial Lines. Core commercial auto incurred severity increased 6% (2023), 9% (2024) and 4% (2025); the infographic’s approximately 20% compounds these calendar-year changes. The measure is insurer-specific and includes physical damage coverages. View source
- Infographic calculation notes. Partner billing rate growth of approximately 16.7% compounds CounselLink increases of 5.1% (2024), 5.1% (2025) and 5.6% (January–July 2026 vs. the same period in 2025). Because reporting periods differ, the result illustrates cumulative rate pressure rather than a directly observed continuous-period increase. The infographic compares indicators across different periods and should not be read as a matched-period inflation analysis.
- Insurance Information Institute. “Triple-I: Homeowners Insurance Market Shows Early Signs of Stabilization as Post-COVID Inflation Pressures Level-Set Into ‘New Normal’ for Risk Pricing.” 17 Dec. 2025. Structural replacement costs described as up nearly 30% over five years; the 5.4% annual rate is an approximate calculation using 30%. View source
- Ajit, Vinitha, Arnaud Vanolli, and Thomas Holzheu. “Liability Excess Inflation: Still a Key Challenge for Insurers and Their Clients.” Swiss Re Institute, 8 Jan. 2026. View source
- Lynch, Jim, and William Nibbelin. “Increasing Inflation on Liability Insurance: Impact as of Year-End 2024.” Insurance Information Institute and Casualty Actuarial Society, Oct. 2025. View source
- Insurance Information Institute. “Facts + Statistics: Auto Insurance,” Private Passenger Auto Insurance Losses, 2015–2024. Data from ISO, a Verisk business; paid claims, all limits, including loss adjustment expense. A separate data series from the Triple-I/CAS severity measures. View source
- National Council on Compensation Insurance. “2026 State of the Line Guide” and “2026 State of the Line At a Glance.” May 2026. Accident year 2025 figures are preliminary; lost-time medical severity differs from the Medical Data Call cost-per-claim measure and its price and utilization components. Guide | At a Glance
- Risk & Insurance Editorial Team. “Liability Claims Crisis: Non-Economic Inflation Reshapes Insurance Markets.” Risk & Insurance, 9 Jan. 2026, reporting Swiss Re Institute analysis. View source